Using Gradients
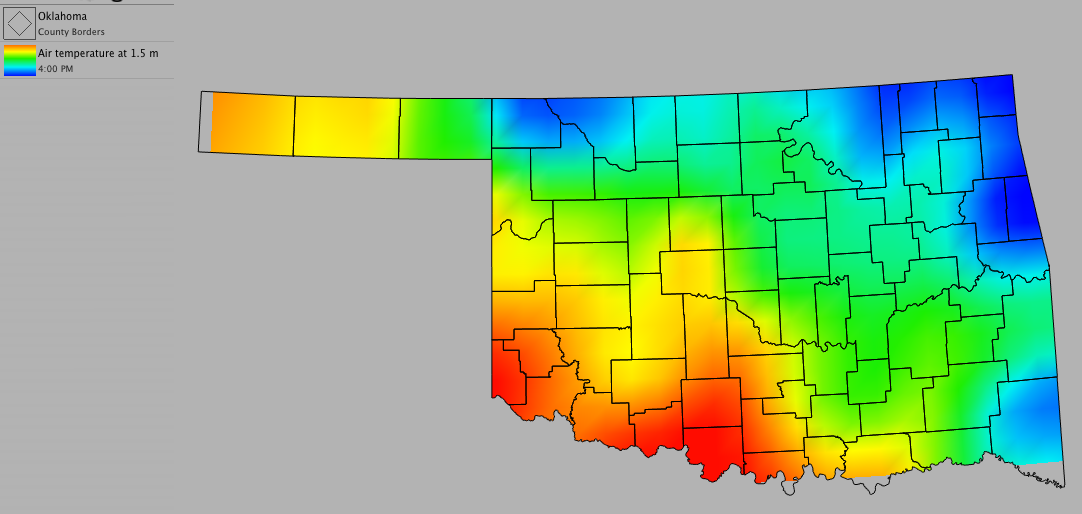
A gradient is the increase or decrease in the magnitude of a property (such as temperature) observed in passing from one point to another. Gradients use color instead of contour lines to show the increase or decrease in magnitude. Gradients are good for locating boundaries and other extreme changes in meteorological data.
To add a new gradient:
- Choose Product > New > Gradient...
- Select the data set you want to use from the drop-down menu
- To narrow down the variable list, type a few letters of your chosen variable in the filter
- Select the variable you want to use from the drop-down menu
- Select the units you want to use from the drop-down menu
- Click OK
Optional Settings:
- To create a customized minimum and maximum range for the gradient, uncheck "Auto" and enter the desired values
- To change the opacity (transparency) of the gradient, move the tab on the slider
Color Editing Options:
- To change the numbers associated with a specific gradient, slide the tabs on the color bar. You can modify the colors of the gradient by selecting a tab and changing the color by clicking on the color well.
- Double-click on the color bar to add tabs
- To delete tabs, double-click on the tab OR select the tab and hit the Delete key
- To modify the range of the gradient, slide the tabs to the left or right
- If you are dissatisfied with the changes you made on the color bar, click "Revert to Standard" to return to the default settings