![]()
Answer to Question 2 |
Question 2. Look at the KTLX reflectivity image from 2:30 p.m. What feature is indicated in this plot? What features in Mesonet data are correlated with the reflectivity image? |
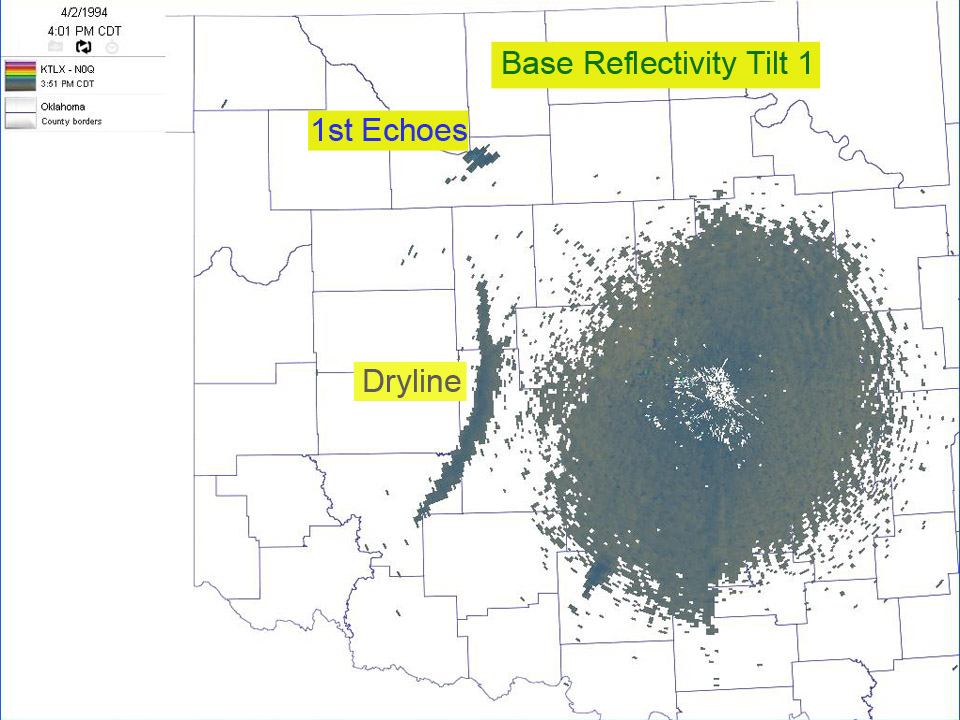
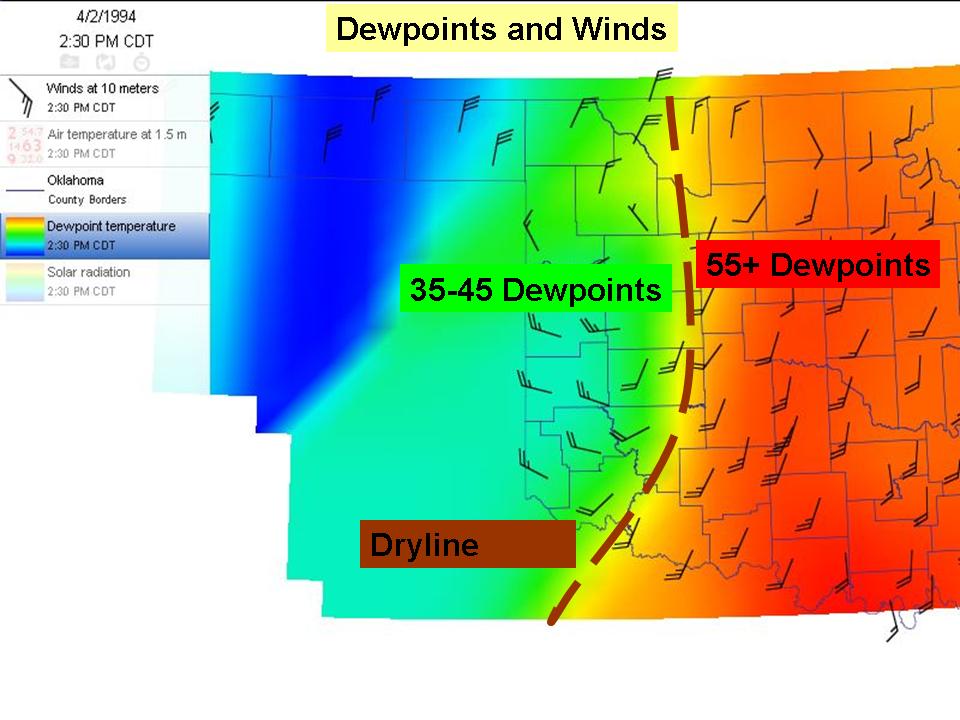
| Answer. Mesonet data indicates a dryline starting near Enid and extending south to southwest. The dewpoints and wind direction changes help illustrate this dryline. The radar also picks up the dryline when it moves near the OKC metro area. This reminds participants to look at mesonet and radar data to locate boundaries. |
|